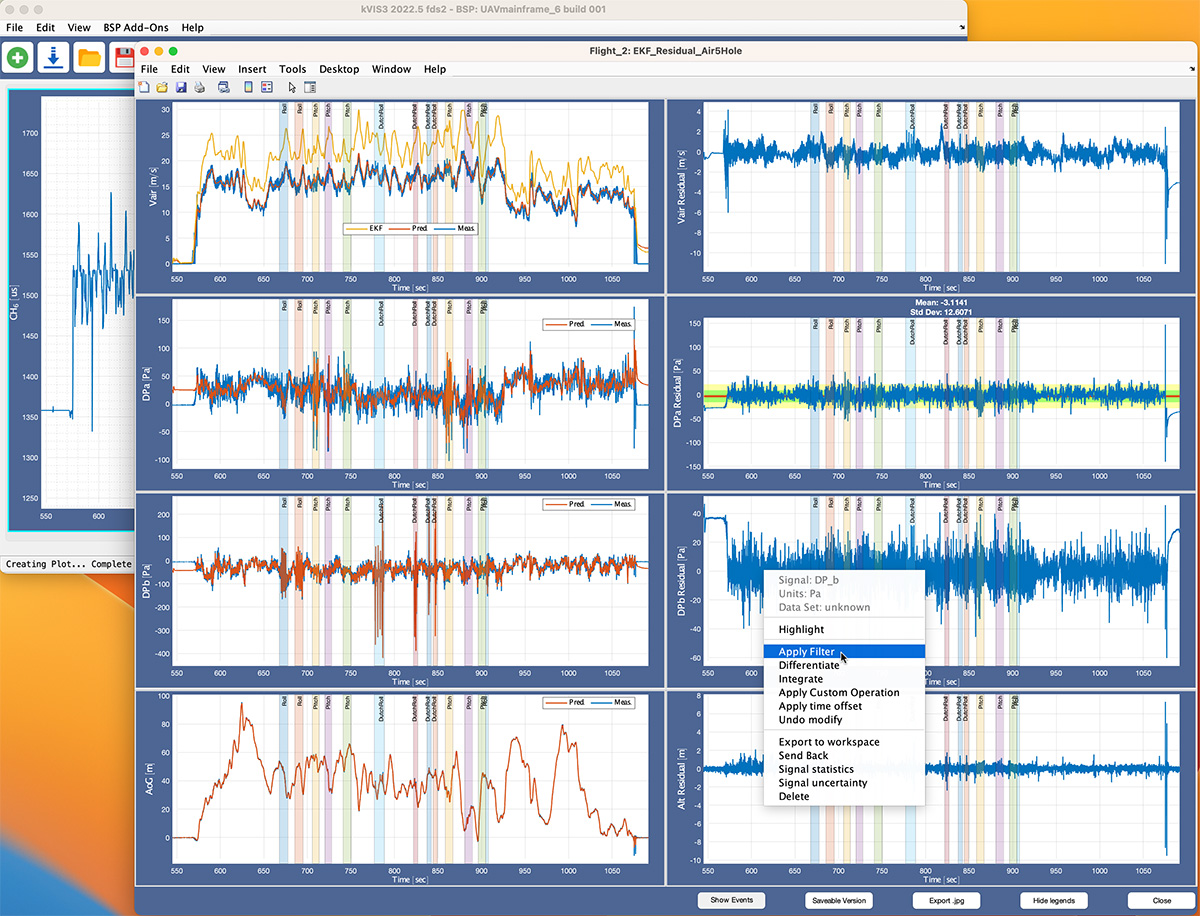
A major update to the custom plots feature:
- now saveable as .fig with preserved layout (static version with interactive elements removed)
- all line context menu functions available for custom plots
- event boundary plots have same colors in all axes
- default line width can be set in the preferences


