kVIS3 — Kai’s Data visualisation, analysis and management tool (3rd edition)
Inspired by the SIDPAC GUI by E.A. Morelli, kVIS3 has been developed over the years to become a fully featured application for experimental data analysis and management. It runs in Matlab.
Features:
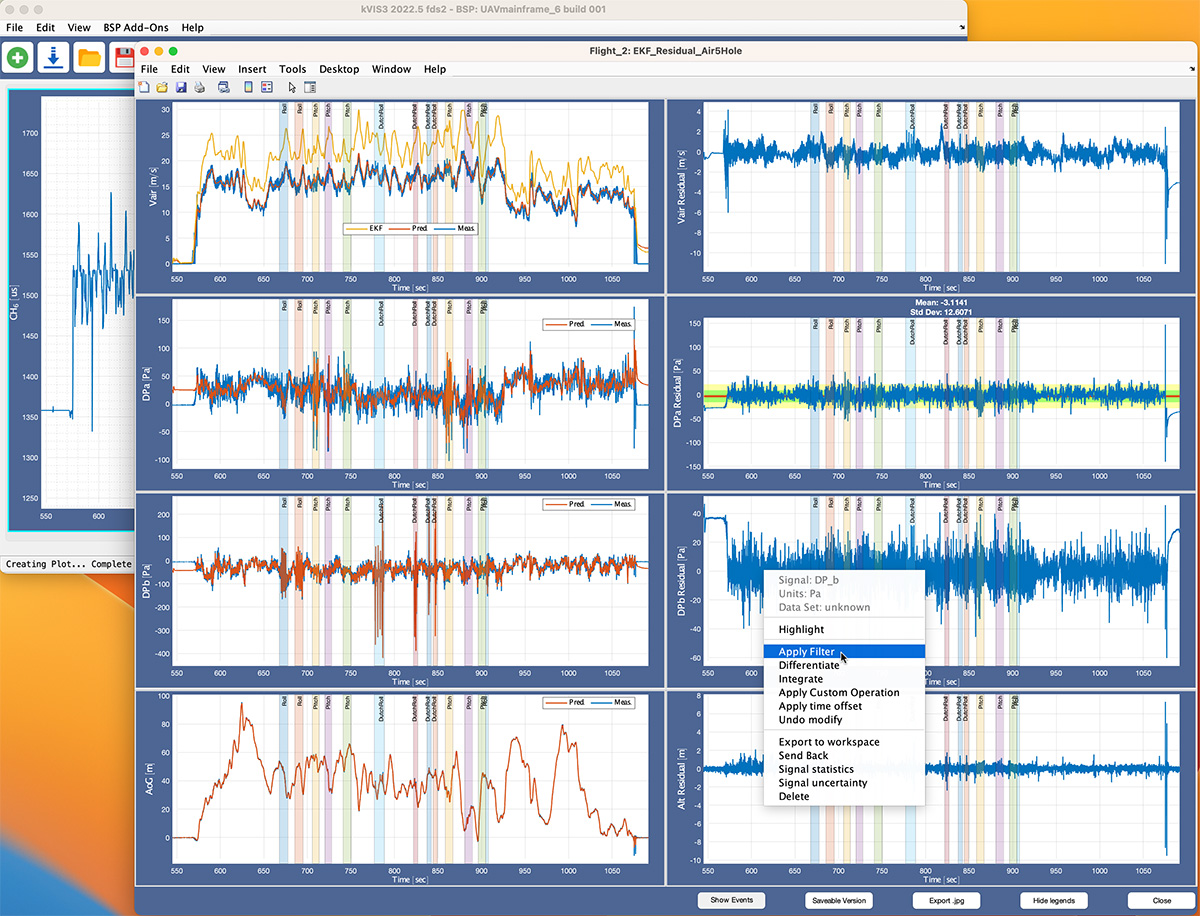
- present large amount of data in an accessible tree structure ( 4000+ data channels are routinely used by the author )
- supports non-uniform sample rates between data groups
- supports multiple data sets concurrently (WiP)
- flexible plot axes framework to freely define desired layout and mixing of different plot types
- data set trimming
- marking of significant time points in the data with events
- definition of quickly accessible custom plot layouts
- export data as CSV or into the Matlab workspace
- google map plot (requires API key) or open street map plot
- data manipulation with filters and freely defined Matlab functions via context menus
- Report generator
- plug in architecture for custom extensions
kVIS3 is released under the GPL V3 license and is developed on Github.

Main window


